Build More Clubs?

Do you think your part of the world simply cannot support any more Toastmasters clubs, that there’s too many clubs already, and new clubs just take members away from existing clubs?

Well, if you live in Bahrain, New Zealand, Qatar, or Singapore, you might be right.  Anywhere else in the world, you can look to those four countries for an example of being able to build even more Toastmasters clubs.

Looking at just the 27 countries with at least 60 clubs (the minimum for a district), Bahrain has the most clubs per capita, with 74 clubs for 1.5 million people — a club for every 19,895 people.  New Zealand follows with a club for every 20,174 people, then Qatar at 23K, and Singapore at 25K.  (Smaller numbers mean higher density, more clubs for the population.)

At the other end, we have Indonesia, with 71 clubs for 276M people, or one club for every 3.9M people, followed by China at one club for every 2.3M people, and India at one club for every 1.4M people.  And no great surprise, this is where much of the growth is happening!

The United States, the home country of Toastmasters, has one club for every 48K people, and Canada has one for every 34K people.

If we look outside the countries with lots of clubs already, we have Sint Maarten (in the Caribbean) with 12 clubs for just 43K people — one club for every 3,616 people!  Many other Caribbean islands have almost as amazing numbers, with Montserrat at one club for every 4,992 people, Bonaire at 5,026, Curacao at 6,818, and more.

Zooming in to the U.S. state and Canadian province level (where 52% of the clubs are), the District of Columbia is in the lead for club density, with 97 clubs for 713K people, or one club for every 7,349 people.  (This may be in part due to people living outside the District, but working in and joining clubs in the District.)  The first actual state is Hawaii, with 68 clubs for 1.4M people, or one club for every 21K people, followed by Manitoba at 22K, British Columbia at 24K, and Minnesota at 27K.

The states and provinces with the lowest density (and biggest growth opportunity) are West Virigina with just 3 clubs for 1.8M people, or one club per 591K people, then Newfoundland with 2 clubs for 529K people or one club per 264K, Puerto Rico (15 clubs) at one club per 218K, and Kentucky at 156K.  If West Virigina had the same number of clubs for 1.8M people as is the national average, that would be 33 more clubs!

California has the most clubs (1,261 clubs), of course, with one club per 31K people, and Texas (593 clubs) has the next most, at one club per 49K people.  The Canadian province with the most clubs is Ontario (513 clubs), at one club per 30K people.

So, the next time someone tells you there’s no room for more clubs – consider the examples you can find in the rest of country, the rest of the world.  Grab a map of your locality, plot out where the existing community clubs are, and identify gaps between them where there are people who would benefit from a new Toastmasters club.

For more details on your country and state or province, see the attached spreadsheet.

Are rural Toastmasters clubs at a disadvantage?

CowIt’s an often repeated claim that rural Toastmasters clubs have trouble getting members and growing and thriving.  Is it true?  I put the question to the test, using U.S. clubs, 2012-13 DCP performance, their meeting place ZIP codes, and U.S. census data.

First, I grouped U.S. clubs into four buckets based on the population of the ZIP code that they meet in.  This gave me some reasonably equal-sized categories to look at.  Then I looked at club size and Distinguished Club Program (DCP) performance in each of those categories:

Size Pop in ZIP # clubs Active mem % disting
Rural <10,000 people 1,265 18.7 43.9%
Town 10-20,000 people 1,623 18.3 44.6%
City 20-40,000 people 3,493 18.7 49.0%
Big City >40,000 people 1,459 19.2 51.3%

Clubs in big cities do tend to be a little larger, a half member more, and are somewhat more likely to be distinguished.

(Sorry, mapping clubs to postal codes and census data tracts is more difficult or even impossible in other countries, I have no data available for them.)

Toastmasters at a glance: 2013 infographic

InfographicThumbnail
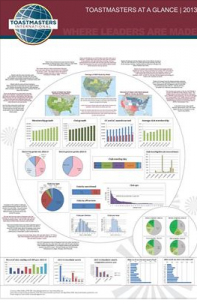
I’ve seen lots of interesting infographics from other organizations, but never one for Toastmasters, so I created my own, a 24″x36″ poster, and had 1,000 copies printed to hand out at the convention this month.  They were quite popular, all given away in just three evenings, almost all just one at a time.  Some people even asked me to autograph them!

Since it can be a little hard to print something that size on your printer at home (or even at work), I’ve also put the same content into a 9-page document formatted for regular paper.

Share this with your clubs and district, to help our members understand there’s much MUCH more to Toastmasters.

Full-size poster

9-page regular paper

Toastmasters quiz: Where in the world is District 87?

I’ll admit it … for many district numbers, I have NO idea where they are.  But I better learn them.  Being a computer guy, I figured a little quiz would make it fun and easy.

Think you know what district Rhode Island belongs to?  Try this quiz (the questions change each time):

http://mikeraffety.com/GeoQuiz.cgi

Add a comment here with your score, and any ideas you have for another quiz!  I’m already planning a Toastmasters trivia quiz too.

P.S.  D87 is the new district covering East Malaysia, Indonesia and Brunei, split off from D51 on July 1, 2010.

Countries with the most membership change

I saw an interesting discussion on LinkedIn asking about what areas experienced the most membership growth — or loss.  I modified my club type script and ran it against the 2009-10 data, and got some interesting data.

First, to no great surprise, the country with the greatest loss was Haiti, down 323 members (net change, July 1, 2009, to June 30, 2010).  Not far after that was Taiwan (down 166), Netherland Antilles (down 47), and Kuwait (down 29).

The biggest gains were United States with 1,962 members (net increase), Canada (up 1,079 members), India (920 members, no surprise there!), China (881 members), Australia (620), and Malaysia (481).

Within the US, Virginia had the biggest net membership loss (down 197 members), Alabama (down 116), and Indiana (down 103).  The biggest increases were California (up 1,962 members!), Texas (up 1,219), Florida (up 935), New York (up 766), and Illinois (up 504).

Here’s a graphic showing the data — brighter green is more total members added in 2009-10 (NOT adjusted for population!).

District maps?

Over the years, many have inquired about maps by district, but unfortunately, precise definitions of district boundaries are hard to get.  As a sort-of approach, I did try mapping clubs for districts by ZIP code, and it does give you a feel for how the districts are laid out.  Here’s a couple of maps; the blank spots between blobs of color are ZIP codes with no Toastmasters clubs.  Click on a map for a larger version; the district number is there near the middle of the blobs of each color.

Southwest USA:

Northeastern USA:

More Toastmasters maps

Here’s another map comparing the number of Toastmasters clubs in a state to the population.  Darker green means more clubs per 100,000 residents.  Interestingly, Minnesota (and generally the northwest USA) has the highest density of clubs, while the southeast has the lowest.  West Virginia has the lowest number of clubs per capita, and Kentucky and Maine are close behind.

This is as of 2007 census data, and July 2010 club data.  Unfortunately, census data for other countries is hard to get (not included with MapPoint anyway).

Mapping out Toastmasters

Here’s some interesting maps showing how strong the DCP is by country, state, or province for several regions of interest.  The darker green, the higher average DCP score for each club in 2009-10.  Click on a map for full size.

US/Canada by state/province (Nevada and Quebec have the best-performing clubs, Wyoming and Vermont the most opportunity for improvement):

Europe (UK and Scotland are the strongest):

Australia by state (Northern Territory may seem strongest, but they only have two clubs!):

Southern Africa by country (District 74):

South Africa by province:

This was done using Microsoft MapPoint 2010, very interesting tool!