Long-term new club retention

How well are we doing with retention of new clubs?  I looked at clubs that chartered in the 2007-08 year (two years ago) three different ways, by club type, open/group-specific, and whether they were advanced.  (Every Toastmasters club has these three different characteristics; yes, you can have a “company open” club, or a “community group-specific” club.)

Of those clubs chartered two years ago, as of last month, we had lost 20% of the nearly-1000 new clubs (how does that compare to your district?).  Out of that, we lost 27% of the company clubs, but just 10% of the community clubs.

Looking at the same clubs a different way, we lost 23% of the group-specific clubs (i.e., closed, or organization-aligned), while we lost just 14% of the open (typically community, but not always) clubs.

Out of 37 advanced clubs chartered that year, we’ve lost just one, 2.7% (it was in Taiwan).

Conclusion:  It does appear that closed/company/group-specific clubs are much harder to retain, perhaps 2-3 times higher failure rate, over that first two years, which is the hardest time for a club.  Club mentors are so important (though I don’t have data to prove that).

Club type          Lost Total  Percent
Company             148   558   26.52%
Community            34   325   10.46%
College               6    33   18.18%
Other/Specialized     3    24   12.50%
Govt Agency           3    32    9.38%
Correctional Inst     1     5   20.00%
Military              1     3   33.33%
Church                1     5   20.00%

Open/group specific
Group Specific      149   652   22.85%
Open                 47   332   14.16%

Advanced
N                   195   946   20.61%
Y                     1    37    2.70%
Toastmasters store trivia

I’ve heard several people complain that the new “catalog” doesn’t include prices, which does make it easier to be flexible on prices (instead of having to fix them for a full year).  I decided to create a “store price sheet”, which just lists the items with a short description, item number (with link to the TI store page), and price.  Note that it does NOT update with new prices automatically, it’s a snapshot of today’s prices.

http://mikeraffety.com/StorePricesSorted.html

What’s the most expensive item TI sells?  The timing signal light, $185, followed by the “How to Write and Deliver Great Speeches (DVD/Study Guide)” ($149).

How to Write and Deliver Great Speeches (DVD/Study Guide)

Countries with the most membership change

I saw an interesting discussion on LinkedIn asking about what areas experienced the most membership growth — or loss.  I modified my club type script and ran it against the 2009-10 data, and got some interesting data.

First, to no great surprise, the country with the greatest loss was Haiti, down 323 members (net change, July 1, 2009, to June 30, 2010).  Not far after that was Taiwan (down 166), Netherland Antilles (down 47), and Kuwait (down 29).

The biggest gains were United States with 1,962 members (net increase), Canada (up 1,079 members), India (920 members, no surprise there!), China (881 members), Australia (620), and Malaysia (481).

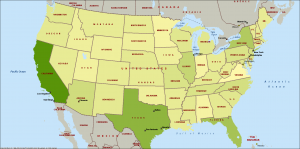
Within the US, Virginia had the biggest net membership loss (down 197 members), Alabama (down 116), and Indiana (down 103).  The biggest increases were California (up 1,962 members!), Texas (up 1,219), Florida (up 935), New York (up 766), and Illinois (up 504).

Here’s a graphic showing the data — brighter green is more total members added in 2009-10 (NOT adjusted for population!).

District hall of fame

Added one more new feature to the district reports.  My own district needed a list of the distinguished divisions, areas, clubs, and educational awards for last year to use at the fall conference, so I wrote a little Perl script to do it, and as long as I was at it, ran it against the rest of the districts as well.  You can find it on the reports page on my site, after clicking on a district, there’s a link labeled “Hall of fame”.

Member sponsor reports

As you may know, TI publishes a list of the members who have sponsored three or more new members for the year, in a big fat PDF with all the districts together.

I’ve added another feature to the reports on my web site, breaking out member sponsors by district, and by month as well.  My home district recognizes member sponsors on a monthly basis to keep membership building front and center on a frequent basis, and previously, this was manually done by reading through the PDF report (which can be around a thousand pages by June!).

You can see it by going to the reports page, clicking on a district, and then clicking on “Mem sponsor report”.  It will re-run any time the district reports change (usually Fridays), but TI only publishes the new numbers on a monthly basis, and that can be 4-8 weeks after the close of the month, since they must manually match up the sponsor names with member records.

Feedback and comments are appreciated!

What’s the most common club name?

A comment at a division speech contest tonight got me to wondering. In District 30 alone, we have three clubs with the name “Speakeasies” (or some spelling variant thereof) as a key part of their name. There’s no requirement for club names to be unique — what are the most common names?

The most common words in the names of 11,766 active clubs are (with the number of clubs listed first):

9231 club
4961 toastmasters
477 speakers
459 of
381 the
223 city
171 communicators
170 talkers
155 toast
152 speaking
131 talk
130 masters
121 toasters
121 valley
111 speak
106 advanced
90 &
84 voices
75 town
73 county
66 and
66 orators
63 university
61 state
61 west
60 park
57 first
56 new
53 north
53 mandarin
53 bay

Hmm, looks like “Speakers of the City” would be a winner — but there’s no club with that name! Just interesting trivia.

More numbers — and graphs!

I added a number of new report features over the last week or two:

1.  The weekly district performance report now includes a small bar graph showing progress on the four Critical Success Factors (CSF).  The newest version also includes a green line showing “now” as a percentage of the year.

2.  The district performance graphs adds a large graph showing how the divisions are doing with the CSFs (pro-rated based on the number of clubs in each division).  This is followed by smaller graphs showing the performance of the district month-by-month over the last four years, making it easy to see how you’re doing compared to past years.  These smaller graphs cover the four CSFs, plus the three “important” success factors (distinguished clubs and areas, and leadership awards), plus the distinguished district points.

3.  The Division Dashboard is another major new feature, merging area performance numbers from the Distinguished Club Program, Distinguished Area Program, and CSFs, all into one report.  District 30 is using this as the numbers core of the monthly DEC meeting reports from the Division Governors.  I’ve got more plans to develop this further with some charts.

4.  Last year’s daily/weekly reports were moved into an archive.  They’re still accessible if you click on the “2007-08” link at the bottom of the list of dates.

Enjoy — and feedback, particularly new ideas, is appreciated!

P.S.  Remember, you can get the daily or weekly district reports in an e-mail, just write me and ask, be sure to mention which district you want to see.

Clubs per country or state?

If you know me, I love numbers (and people!). A discussion with someone at the Calgary convention made me think of some interesting analysis. (Based on the chartered clubs as of July 23, 2008.)

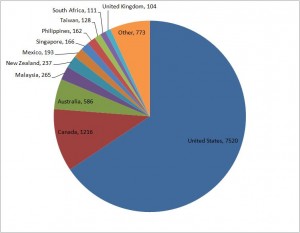
What countries have the most Toastmasters clubs — how much of them are overseas? (Click on the graphic to view full size and readable.)

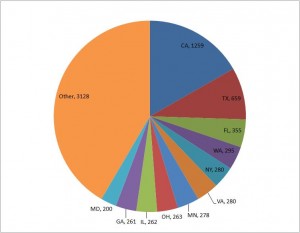
Which U.S. states have the most Toastmasters clubs?

Which states have the highest number of clubs for their population size? (I.e., they have a lot more Toastmasters clubs than “normal”.)

State Clubs Population Per capita
Washington, DC 132 588,292 4,457
Minnesota 278 5,197,621 18,696
Hawaii 62 1,283,388 20,700
Washington 295 6,468,424 21,927
North Dakota 29 639,715 22,059
Montana 42 957,861 22,806
Oregon 153 3,747,455 24,493
South Dakota 31 796,214 25,684
Nebraska 65 1,774,571 27,301
Alaska 25 683,478 27,339

Or the least number of clubs for their population? (I.e., could be our biggest opportunities for growth.)

Rhode Island 16 1,057,832 66,115
New York 280 19,297,729 68,920
Alabama 63 4,627,851 73,458
Pennsylvania 162 12,432,792 76,746
Louisiana 50 4,293,204 85,864
Arkansas 29 2,834,797 97,752
Maine 13 1,317,207 101,324
Kentucky 40 4,241,474 106,037
Mississippi 26 2,918,785 112,261
West Virginia 13 1,812,035 139,387

Interesting stuff. And yes, it would probably be more useful to produce these statistics by district instead of state, but it’s remarkably hard to pin down the exact definition of a district’s geography, and then even harder to determine the population in the district.

Maybe gives us some ideas on where to focus our marketing, where we have the lowest penetration for the Toastmasters program — or the greatest successes!

Now it’s a REAL blog!

Up until now, I’ve been writing this “blog” as a regular web page, with no opportunity for anyone to provide feedback. I’ve converted it to WordPress now, a real blog with a ton more features. It was much easier than I expected, and there’s so much more cool stuff that WordPress can do, highly recommended!

Please DO leave feedback, it’s much appreciated!

Reaction to the district directory

Wow! I woke up this morning, and had a dozen or more replies from people who had already looked at the directory and had the most flattering comments! Some couldn’t believe this was all on the TI web site, they didn’t know it was out there. And it certainly had never been pulled together in this way before, easy compact reference, organized by district officer role. Really happy with the reaction I’m getting, it’s simply amazing!