Analysis of 2022 Toastmasters tax return 990

The 2022 990 tax return for Toastmasters International has been released. Total revenue was down 10%, and expenses were up by $5.6M (24%), resulting in a “loss” (revenue minus expenses) of $2.6M (compared to a gain of $6M in 2021).  Total salaries were up 3.5% (48% of all expenses, down from 58% in 2021), and the number of employees is essentially unchanged at 164 (up by 1, less than 1%).

Expenses and vendors

The largest increase in expenses by dollar amount were district expenses (up $2.1M), “Conferences, conventions, and meetings” (up $1.1M), “other” (up $812K), property taxes ($633K, not previously broken out), travel ($633K; this was the first in-person convention after the pandemic), payroll (up $468K), and information technology (up $337K).

  • Payroll (including all related expenses, like benefits and pensions) was by far the largest single expense, at $13.8M (up $468K or 3.5% from 2021).
  • District expenses were up $2.1M or 62% at $5.4M (but still well below 2019 pre-pandemic levels at $9.7M).
  • Depreciation was up 24% to $1.7M.
  • “Conferences, conventions, and meetings” was up 186% (nearly tripled) to $1.6M (from $0.6M)
  • Information technology was up 38%, to $1.2M.
  • “Other” is up $812K to $2.1M, from $1.3M in 2021. (The IRS does not require this to be broken out into detail as long as it’s below 10% of the total expenses, and this is 7.5%.)

Expenditures on club-building and leadership training by world (not TM) region are interesting, it does cost significantly more to support members outside of North America. Much of this increase is just a return to pre-pandemic normal levels, such as in-person training and meetings.

  • North America, $651K (doubling $326K for the previous year)
  • East Asia/Pacific, $1.3M (up from $945K)
  • Middle East/North Africa: $415K ($94K)
  • Sub-Saharan Africa: $294K ($239K)
  • Central America/Caribbean: $101K ($20K)
  • South America: $45K ($13K)
  • South Asia: $745K ($400K)
  • Europe, $538K ($243K)
  • Russia and neighboring states, $24K (a new category for 2022)

The five largest vendors for Toastmasters were:

  • Cornerstone Ondemand, $923K (up from $880K the previous year, the Pathways web site)
  • Dynatech Systems, India, $741K (up from $512K, “IT and software services/support”)
  • Intrado Digital Media (now named Notified), $613K (not listed in 2021, “web casting, audio/video production”)
  • Sourceved, India, $508K (up from $393K, “software development”)
  • RR Donnelley & Sons, $439K (down from $1.1M last year and $2.8M the previous year, logistics and communications, most TI store sales

12 more companies were paid at least $100K (each) in 2022.

Employee compensation

Staff designated as key must have compensation publicly reported (per U.S. non-profit tax law), listed below.

  • CEO Dan Rex, $411K base compensation (up 0.5%) plus a $66K bonus (same as 2021, 16% of base), for $517K total compensation (0.1% decrease due to some lower benefits)
  • Chief financial officer John Bond, $306K (includes a 4.8% bonus, total comp up 1% from 2020)
  • Chief information officer Heidi Hollenbeck, $292K total comp (new this year)
  • Senior director enterprise app & project Michael McGurk, $200K (new this year)
  • Controller Margaret Yamamoto, $191K (5% increase)
  • Marketing/communications director John Lurquin, $190K (11% increase)
  • HR director Gary Kinser, $175K (1% decrease, also due to some lower benefits)
  • Partnership and development director Angela Cunningham, $160K (4% increase)
  • Club quality and member support director Danielle Mitchell, $159K (6% increase)
  • Secretary/education director Kathryn Rynerson, $158K (5% increase)

The CEO’s compensation was established using a compensation committee, a compensation survey or study, and approval by the board or compensation committee (per the tax return, Schedule J).  This year (like last year), the tax return indicates that the form 990 of other organizations was not used and that there was no written employment contract, while those boxes have always been checked in recent years. This is the second year that an independent compensation consultant was used.

Expenses included paying for companion travel (as in previous years), and did not include any first class/charter travel or tax indemnification/gross-up payments (per the tax return). There is a written reimbursement policy, and substantiation of expenses is required.

Revenue and assets

Total program revenue shrank by 3%, to a total of $26.8M.  The Toastmasters district conferences globally took in $887K in revenue (up sharply from $286K in 2021, but nowhere near the $3.7M in pre-pandemic 2019).  The annual convention pulled in $720K (up from $214K in 2021, and getting closer to the 2019 level of $1.0M).  For materials sold, the sales revenue only covered 6% of the cost, resulting in a $2.1M loss on sales (better than the $2.4M loss in 2021). In 2021, the loss was 85%, in 2020, the loss was 82%, in 2019, the loss was 47%, in 2018 the loss was 51%, while in 2017, there was a 6.8% loss.

Total assets shrank by 5.3%, to $59.8M, of which $32.1M is cash and investments, equal to 1.12 years of expenses (compared to 1.53 years in 2021, 1.23 years in 2020, 0.65 years in 2019, 0.63 years in 2018, 0.52 years in 2017, 0.56 years in 2016, and 1.2 years in 2015), in the range of the recommendation for non-profits to have 1-2 years of expenses saved up in reserves.  The land and building at WHQ is valued at a net of $25.5M (down 1%).  Inventory has decreased by 13% (after decreasing by 14% in 2021, 16% in 2020, and 13% in each of 2019 and 2018), to $435K.

Net assets shrank by $3.3M (5.3%), mostly due to $2M less cash and $1.1M less investments. Liabilities are up somewhat, mostly due to $1.1M more in accounts payable.

Related organizations

Three organizations are identified as related, “Toastmasters International Singapore Ltd”,“Toastmasters International (Hong Kong) Ltd”, and “Shenzen Toastmasters Culture Exchange”, all companies for “legal and compliance administration” (also controlled by TI).

One contributor of over $5K is listed, with that person (name redacted, as permitted by IRS regulations) contributing $7,199.

Click here for the full 2022 tax return.

2021 tax return analysis
2020 tax return analysis
2019 tax return analysis
2018 tax return analysis
2017 tax return analysis
2016 tax return analysis
2015 tax return analysis
2014 tax return analysis
2013 tax return analysis
2012 tax return analysis
2011 tax return analysis

Good clubs: Big districts or little districts?

Do big districts or little districts do a better job of supporting their clubs? There’s a logical argument going either way; big districts have more resources and depth in talent, and small districts allow more focused attention. I ran the numbers.

Roughly, for every additional 100 clubs in the district base, there’s 11% higher level of distinguished clubs, e.g., from 100 clubs at 38% to 200 clubs at 49% to 300 clubs at 60%.

The performance base is the last 5 years across all districts, spreadsheet attached with graphs to make the story clear. Stratifying the data into deciles of performance makes the trend even more apparent.

Once you get past the 200 clubs level, it’s VERY unusual for the percent of distinguished clubs to drop below 40%.

I think the reason is that while areas and divisions are all about the same size regardless of the district, the trio candidates come from a much larger pool in big districts, resulting in better trios and better better club performance.

My own district (originally 30) has ranged in size from nearly 250 (2013-17, pre-split) to 80-odd clubs (post split, and still shrinking). We often had multiple good candidates for LGM/CGD before — and now we struggle to get one decent candidate and a weak placeholder candidate to meet the required two minimum. We’re recycling past PDGs/PDDs into the trio again more often as well (which we NEVER did as a large district).

So the action? When splitting, I mean REFORMING districts, I think we should set a higher threshold, like 120 clubs in the resulting districts. Let bigger districts get a little bit bigger before splitting if necessary. Close/consolidate districts sooner than a low end of 60, maybe set a minimum of 100.

Build More Clubs?

Do you think your part of the world simply cannot support any more Toastmasters clubs, that there’s too many clubs already, and new clubs just take members away from existing clubs?

Well, if you live in Bahrain, New Zealand, Qatar, or Singapore, you might be right.  Anywhere else in the world, you can look to those four countries for an example of being able to build even more Toastmasters clubs.

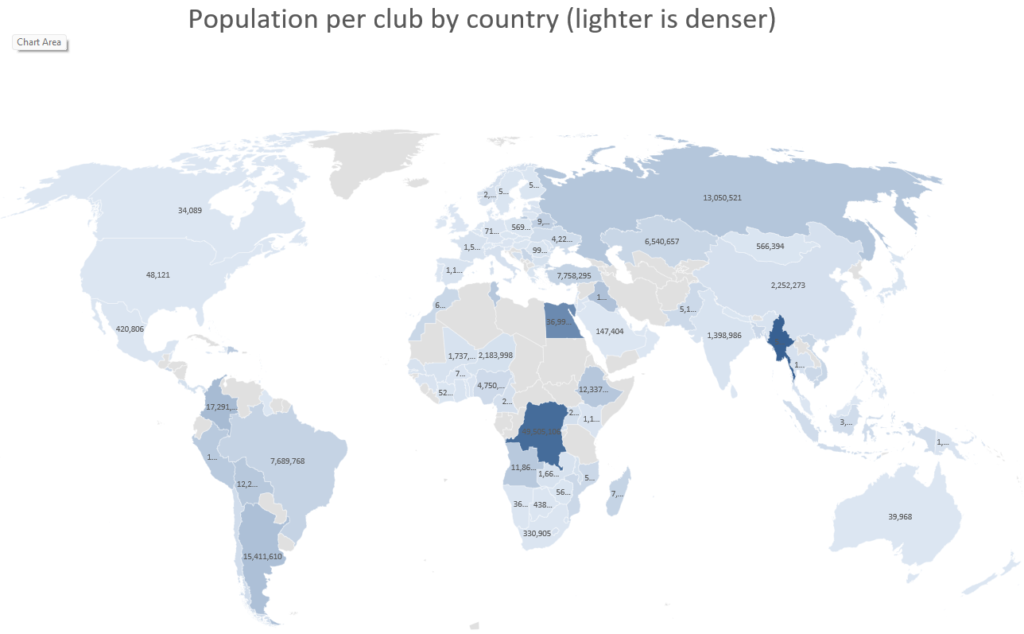
Looking at just the 27 countries with at least 60 clubs (the minimum for a district), Bahrain has the most clubs per capita, with 74 clubs for 1.5 million people — a club for every 19,895 people.  New Zealand follows with a club for every 20,174 people, then Qatar at 23K, and Singapore at 25K.  (Smaller numbers mean higher density, more clubs for the population.)

At the other end, we have Indonesia, with 71 clubs for 276M people, or one club for every 3.9M people, followed by China at one club for every 2.3M people, and India at one club for every 1.4M people.  And no great surprise, this is where much of the growth is happening!

The United States, the home country of Toastmasters, has one club for every 48K people, and Canada has one for every 34K people.

If we look outside the countries with lots of clubs already, we have Sint Maarten (in the Caribbean) with 12 clubs for just 43K people — one club for every 3,616 people!  Many other Caribbean islands have almost as amazing numbers, with Montserrat at one club for every 4,992 people, Bonaire at 5,026, Curacao at 6,818, and more.

Zooming in to the U.S. state and Canadian province level (where 52% of the clubs are), the District of Columbia is in the lead for club density, with 97 clubs for 713K people, or one club for every 7,349 people.  (This may be in part due to people living outside the District, but working in and joining clubs in the District.)  The first actual state is Hawaii, with 68 clubs for 1.4M people, or one club for every 21K people, followed by Manitoba at 22K, British Columbia at 24K, and Minnesota at 27K.

The states and provinces with the lowest density (and biggest growth opportunity) are West Virigina with just 3 clubs for 1.8M people, or one club per 591K people, then Newfoundland with 2 clubs for 529K people or one club per 264K, Puerto Rico (15 clubs) at one club per 218K, and Kentucky at 156K.  If West Virigina had the same number of clubs for 1.8M people as is the national average, that would be 33 more clubs!

California has the most clubs (1,261 clubs), of course, with one club per 31K people, and Texas (593 clubs) has the next most, at one club per 49K people.  The Canadian province with the most clubs is Ontario (513 clubs), at one club per 30K people.

So, the next time someone tells you there’s no room for more clubs – consider the examples you can find in the rest of country, the rest of the world.  Grab a map of your locality, plot out where the existing community clubs are, and identify gaps between them where there are people who would benefit from a new Toastmasters club.

For more details on your country and state or province, see the attached spreadsheet.

2023 Toastmasters annual business meeting proxies

The annual Toastmasters business meeting is where we elect the board of directors, international officers, and amend our governing documents.

Clubs not assigned to a district are assigned to a district director as a proxy option, and so it is possible for districts to get more than 100% of “their” proxies for the business meeting. None did that this year. The percent of clubs represented has varied from 73.5% in 2019, to 66.1% last year, to 70.0% this year (quorum is one-third).

The districts with the best percentage of club proxies were:

  • D70 (Southern Sydney, southern NSW and ACT, Australia), got 95.7%, 134 proxies out of 140 paid clubs (missing 6 clubs).
  • D65 (Western and central New York), got 95.2%, 60 out of 63.
  • D90 (Northern Sydney, Australia), 95.0%, 119 out of 126.
  • D116 (Qatar), 93.5%, 115 out of 123.
  • D120 (Tamil Nadu, India), 92.9%, 144 out of 155.

At the other end of the scale, we had:

  • D79 (Eastern Saudi Arabia), 12.2%, 18 out of 147.
  • D89 (Hong Kong, Macau, Fujian, Hainan and part of Guangdong, China), 24.7%, 23 out of 93.
  • D73 (South Australia, Victoria, and Tasmania, Australia), 38.3%, 46 out of 120.

The top quarter of districts beat 82% representation, the top half beat 70%, and the top 3/4 beat 59%.

The top regions were:

  • Region 13 (southern Asia, India to Singapore), 77.1%
  • Region 8 (Southeastern US, Caribbean, Brazil), 76.1%.

The vast majority of the votes come from clubs (98.8%, two per club), the rest are “at large” members, which is any current or past International Director (which includes International Presidents and officers), and the current District Directors (they each get one vote, regardless of any clubs they also may represent). At-large votes cannot be assigned to someone else (unlike clubs).

Undistricted clubs are randomly assigned a default district director for their proxy, if they choose to do so (they can assign it to anyone, just like all other clubs). That’s why there’s no “U” line in the spreadsheet (and that’s why a district can have more than 100% of the proxies).

Of those votes from clubs, the large majority are represented by the District Directors. There’s no way of knowing just how many.

While there are many more important things for Toastmasters districts to devote scarce resources to (like helping struggling clubs and building new clubs), this shouldn’t be that hard to do. A district proxy chair with a committee to call clubs and round up proxies makes an excellent project!

Full details in the Excel spreadsheet here: Proxies-2023

Here’s my post on the 2022 proxy returns.

Analysis of 2021 Toastmasters tax return 990

The 2021 990 tax return for Toastmasters International has been released. Total revenue was down 2%, and expenses were down 7%, resulting in a “profit” (revenue minus expenses) of just over $6M (compared to nearly $5M in 2020).  Total salaries were up 2.9% (58% of all expenses, up slightly from 52% in 2020), even though the number of employees is slightly down from 168 to 163 (down 3%).

Expenses and vendors

  • Payroll (including all related expenses, like benefits and pensions) was by far the largest single expense, at $13.3M (up 2.9% from 2020).
  • District expenses were flat at $3.4M (down 0.5%).
  • Depreciation added up to $1.4M (unchanged).
  • Insurance was down sharply to $122K (from $1.2M).
  • Travel was down again by 70%, to $102K (from $343K).

Expenditures on club-building and leadership training by world (not TM) region are interesting, it does cost significantly more to support members outside of North America.

  • North America, $326K (up from $295K previous year)
  • East Asia/Pacific, $945K (was $885K)
  • Europe, $243K (down from $302K)
  • Middle East/North Africa: $94K ($219K)
  • Central America/Caribbean: $20K ($31K)
  • Sub-Saharan Africa: $239K ($167K)
  • South America: $13K ($7K)
  • South Asia: $400K ($200K)

The five largest vendors for Toastmasters were:

15 more companies were paid at least $100K (each) in 2019.

Employee compensation

Staff designated as key must have compensation publicly reported (per U.S. non-profit tax law), listed below.

  • CEO Dan Rex, $409K base compensation (unchanged) plus a $66K bonus (16% of base), for $518K total compensation (13% increase)
  • Chief financial officer John Bond, $300K (includes a 7% bonus, total comp up 7% from 2020)
  • Chief information officer Hamidreza (Sam) Farajian (who left in August 2021), $283K total comp (11% decrease, though likely a partial year)
  • Controller Margaret Yamamoto, $182K (2% decrease)
  • HR director Gary Kinser, $176K (6% increase)
  • Marketing director John Lurquin, $171K (4% decrease)
  • Partnership and development director Angela Cunningham, $154K (1% increase)
  • Secretary/education director Kathryn Rynerson, $151K (new to the list)
  • Club quality and member support director Danielle Mitchell, $150K (new to the list)

The CEO’s compensation was established using a compensation committee, a compensation survey or study, and approval by the board or compensation committee (per the tax return, Schedule J).  This year, the tax return indicates that the form 990 of other organizations was not used and that there was no written employment contract, while those boxes have always been checked in recent years. And, this year, for the first time, an independent compensation consultant was used.

Expenses did include paying for travel for companions (as in previous years), and unlike previous years, did not include any first class/charter travel or tax indemnification/gross-up payments (per the tax return). There is a written reimbursement policy, substantiation of expenses is required.

Revenue and assets

Total program revenue shrank by 10%, to a total of $27.7M.  The Toastmasters district conferences globally took in $286K in revenue (up 18%).  The annual convention (online only) pulled in $214K (up from $6K in 2020).  For materials sold, the sales revenue only covered 15% of the cost, resulting in a massive $2.4M loss on sales. In 2020, the loss was 82%, in 2019, the loss was 47%, in 2018 the loss was 51%, while in 2017, there was a 6.8% loss.

Total assets grew by 6.4%, to $63.2M, of which $35.4M is cash and investments, equal to 1.53 years of expenses (compared to 1.23 years in 2020, 0.65 years in 2019, 0.63 years in 2018, 0.52 years in 2017, 0.56 years in 2016, and 1.2 years in 2015), in the range of the recommendation for non-profits to have 1-2 years of expenses saved up in reserves.  The land and building at WHQ is valued at a net of $25.6M (down 1%).  Inventory has decreased by 14% (after decreasing by 16% in 2020, and 13% in each of 2019 and 2018), to $435K.

Net assets grew by $3.8M (6.4%), mostly due to savings/cash investments growing by $6.9M and investments growing by $787K (other smaller shifts canceled some of this out, including apparently zeroing out the cash account for the end of the year, which was $2.9M in 2020). Liabilities are down somewhat, but the $2.2M unsecured note/loan from 2020 is gone. There’s new listings for other liabilities, with gift certificates at $145K, customer deposits at $324K, and lease liability at $86K.

Related organizations

Three organizations are identified as related, “Toastmasters International Singapore Ltd”,“Toastmasters International (Hong Kong) Ltd”, and “Shenzen Toastmasters Culture Exchange”, all companies for “legal and compliance administration” (also controlled by TI).

Three contributors of over $5K are listed, with the US Small Business Association apparently “contributing” $2.2M, David Blackwealth (of Pennington, NJ) contributing $6K, and Danny and Dawn Oberst (of Dallas, TX) contributing $10K.

Click here for the full 2021 tax return.

2020 tax return analysis
2019 tax return analysis
2018 tax return analysis
2017 tax return analysis
2016 tax return analysis
2015 tax return analysis
2014 tax return analysis
2013 tax return analysis
2012 tax return analysis
2011 tax return analysis

Analysis of 2020 Toastmasters tax return 990

The 2020 990 tax return for Toastmasters International has been released. Total revenue was down 25% (with the Covid pandemic starting), and expenses were down even more, at 36%, resulting in a “profit” (revenue minus expenses) of nearly $5M (compared to nearly $1M in 2019).  Total salaries were down 3.5% (52% of all expenses, up from 35% in 2019), even though the number of employees is down from 198 to 168 (down 15%).

Expenses and vendors

  • Payroll (including all related expenses, like benefits and pensions) was by far the largest single expense, at $13.0M (down 3.5% from 2019).
  • District expenses were down sharply to $3.4M (down 65%).
  • The magazine cost was also down sharply with the last printed and mailed magazine in April 2020, at $764K (down 82%).
  • Depreciation added up to $1.4M (unchanged).
  • Insurance was $1.2M (unchanged).
  • Software cost $869K (down 38% from $1.4M; this may or may not include Cornerstone, as they’re a vendor).
  • Travel was $343K (down 71%).

Expenditures on club-building and leadership training by world (not TM) region are interesting, it does cost significantly more to support members outside of North America. All regions show sharply lower costs, on average 39% lower.

  • North America, $295K (down from $902K previous year)
  • East Asia/Pacific, $885K (was $1,988K)
  • Europe, $302K (down from $827K)
  • Middle East/North Africa: $219K ($678K)
  • Central America/Caribbean: $31K ($84K)
  • Sub-Saharan Africa: $167K ($387K)
  • South America: $7K ($21K)
  • South Asia: $200K ($576K)

The five largest vendors for Toastmasters were:

  • RR Donnelley & Sons, $2.8M for logistics (down from $5.4M last year, most TI store sales)
  • Marriott International, Atlanta, $957K (listed as “hospitality”)
  • HPM Inc., Englewood, CO, $872K (for “tenant construction”)
  • Cornerstone Ondemand, $725K (down from $922K, the Pathways web site)
  • Freeman Audio Visual, $277K (was $284K, convention A/V)

13 more companies were paid at least $100K (each) in 2019.

Employee compensation

Staff designated as key must have compensation publicly reported (per U.S. non-profit tax law), listed below.

  • CEO Dan Rex, $409K base compensation (3.3% increase) plus a $8K bonus (2% of base), for $460K total compensation (16.7% decrease)
  • Chief information officer Hamidreza (Sam) Farajian, $317K total comp (13% decrease)
  • Chief financial officer John Bond, $280K (same as 2019)
  • Controller Margaret Yamamoto, $186K (10% decrease)
  • Marketing director John Lurquin, $179K (18% increase)
  • ERP director Martin Walz, $170K (new to the list)
  • HR director Gary Kinser, $166K (4% decrease)
  • Partnership and development director Angela Cunningham, $153K (new to the list)

The CEO’s compensation was established using a compensation board committee, the form 990 tax returns from other organizations, a written employment contract, a compensation study or survey, and approval by the board or compensation committee (per the tax return, Schedule J).  (The tax form includes one other method for determining compensation which is not used by TI, an independent compensation consultant.)

Expenses did include paying for first-class or charter travel, travel for companions, and tax indemnification/gross-up payments (per the tax return), following a written reimbursement policy, and requiring substantiation of expenses.

Revenue and assets

Total program revenue shrank by 22%, to a total of $30.8M.  The Toastmasters district conferences globally took in $242K in revenue (down 93%).  The annual convention (online only) pulled in $6K (down from $1.0M in Denver in 2019).  For materials sold, the sales revenue only covered 18% of the cost, resulting in a massive $2.5M loss on sales. In 2019, the loss was 47%, in 2018 the loss was 51%, while in 2017, there was a 6.8% loss.

Total assets grew by 8.1%, to $59.4M, of which $30.6M is cash and investments, equal to 1.23 years of expenses (nearly double from 0.65 years in 2019, 0.63 years in 2018, 0.52 years in 2017, 0.56 years in 2016, and 1.2 years in 2015), in the range of the recommendation for non-profits to have 1-2 years of expenses saved up in reserves.  The land and building at WHQ is valued at a net of $25.9M (down 1.9%).  Inventory has decreased by 16% (after decreasing by 13% in each of 2019 and 2018), to $503K.

Net assets grew by $4.5M (8.1%), mostly due to savings/cash growing by $4.3M and investments growing by $804K (other smaller shifts canceled some of this out). Accounts payable shrank by $2.3M and deferred revenue shrank by $1.8M, but a $2.2M unsecured note/load was added to the balance sheet.

Related organizations

Three organizations are identified as related, “Toastmasters International Singapore Ltd”,“Toastmasters International (Hong Kong) Ltd”, and “Shenzen Toastmasters Culture Exchange”, all companies for “legal and compliance administration” (also controlled by TI).

One contributor of over $5K is listed, for $15K, though the name is withheld (as permitted by law).

Click here for the full 2020 tax return.

2019 tax return analysis
2018 tax return analysis
2017 tax return analysis
2016 tax return analysis
2015 tax return analysis
2014 tax return analysis
2013 tax return analysis
2012 tax return analysis
2011 tax return analysis

Analysis of 2019 Toastmasters tax return 990

The 2019 990 tax return for Toastmasters International has been released. Total revenue was down 9.2%, and expenses were down 1.8%.  Total salaries were up 0.2% (35% of all expenses, up slightly from 34% in 2018), even though the number of employees is down from 236 to 198 (down 16%).

Expenses and vendors

  • Payroll (including all related expenses, like benefits and pensions) was by far the largest single expense, at $13.4M (about the same as 2018).
  • District expenses were $9.7M (up 11%).
  • The magazine cost $2.7M (down 4%).
  • Depreciation added up to $1.4M (unchanged).
  • Insurance was $1.2M (unchanged).
  • Software cost $1.4M (up 17% from $1.2M; this may or may not include Cornerstone, as they’re a vendor).
  • Transportation (apparently different from “travel”) cost $976K (down 1.3% from $1.1M).
  • Travel was $1.2M (up 19% from $1.0M).

Expenditures on club-building and leadership training by world (not TM) region are interesting, it does cost significantly more to support members outside of North America.

  • North America, $902K (up from $832K previous year)
  • East Asia/Pacific, $1,986K (was $1,998K)
  • Europe, $827K (up from $595K)
  • Middle East/North Africa: $678K (up considerably from $461K)
  • Central America/Caribbean: $84K ($79K)
  • Sub-Saharan Africa: $387K ($329K)
  • South America: $21K ($6K, reflecting new growth there)
  • South Asia: $576K (up considerably from $306K)

The five largest vendors for Toastmasters were:

22 more companies were paid at least $100K (each) in 2019.

Employee compensation

Staff paid over $100K/year must be reported (per U.S. non-profit tax law), listed below.

  • CEO Dan Rex, $396K base compensation (7.7% decrease) plus a $120K bonus (30% of base), for $552K total compensation (3.8% decrease)
  • Chief financial officer John Bond, $280K (1% increase in base salary)
  • Chief information officer Hamidreza (Sam) Farajian, $326K total comp (3% increase in base salary)
  • Controller Margaret Yamamoto, $206K (base salary up 21%)
  • Application services IT director Nader Hariri, $186K (up 3%)
  • Cloud services manager Albert Hadiprodjo, $164K (new to the list)
  • HR director Gary Kinser, $173K (new to the list)
  • Marketing director John Lurquin, $152K (new to the list)
  • Marketing director William Nissim, $338K (up from $240K, includes $74K in other compensation, likely a termination package)
  • Member engagement officer Darci Maenpa, $296K (up 35%)

The CEO’s compensation was established using a compensation board committee, the form 990 tax returns from other organizations, a written employment contract, a compensation study or survey, and approval by the board or compensation committee (per the tax return, Schedule J).  (The tax form includes one other method for determining compensation which is not used by TI, an independent compensation consultant.)

Expenses did include paying for first-class or charter travel, travel for companions, and tax indemnification/gross-up payments (per the tax return), following a written reimbursement policy, and requiring substantiation of expenses.

Revenue and assets

Total program revenue grew by 5.0%, to a total of $39.7M.  The Toastmasters district conferences globally took in $3.7M in revenue (up 15%).  The annual convention in Denver pulled in $1.0M (down 17% from Chicago in 2018).  For materials sold, the sales revenue only covered half the cost, resulting in a 47% loss on sales. In 2018, the loss was 51%, while in 2017, there was an 6.8% loss.

Total assets grew by 3.8%, to $54.9M, of which $25.4M is cash and investments, equal to 0.65 years of expenses (up from 0.63 years in 2018, 0.52 years in 2017, 0.56 years in 2016, and 1.2 years in 2015), below the range of the recommendation for non-profits to have 1-2 years of expenses saved up in reserves.  The land and building at WHQ is valued at a net of $26.4M (up 1.9%).  Inventory has decreased by another 13% (after decreasing by 13% in 2018), to $602K.

Net assets grew by $1.5M (3.7%), mostly due to prepaid expenses growing by $1M and investments growing by $882K (other smaller shifts canceled some of this out).

Related organizations

Three organizations are identified as related, “Toastmasters International Singapore Ltd”,“Toastmasters International (Hong Kong) Ltd”, and “Shenzen Toastmasters Culture Exchange”, all companies for “legal and compliance administration” (also controlled by TI).

Click here for the full 2019 tax return.

2018 tax return analysis
2017 tax return analysis
2016 tax return analysis
2015 tax return analysis
2014 tax return analysis
2013 tax return analysis
2012 tax return analysis
2011 tax return analysis

2022 Toastmasters annual business meeting proxies

The annual Toastmasters business meeting is where we elect the board of directors, international officers, and amend our governing documents.

Clubs not assigned to a district are assigned to a district director as a proxy option, and so it is possible for districts to get more than 100% of “their” proxies for the business meeting. This year, we had one do that, exceeding the total number of clubs in the district!

The districts with the best percentage of club proxies were:

  • D41 (region 13, North India and Nepal), got 103.4%, 150 proxies out of 145 paid clubs.
  • D88 (region 14, Northeastern China), got 96.9%, 156 out of 161.
  • D113 (region 3, Northern Mexico), 95.0%, 115 out of 121.
  • D62 (region 6, Michigan), 94.9%, 56 out of 59.
  • D23 (region 3, New Mexico, El Paso County, Texas, Oklahoma panhandle), 93.9%, 62 out of 66.

At the other end of the scale, we had:

  • D122 (region 11, Pakistan), 18.6%, 8 out of 43.
  • D92 (region 13, North and central Karnataka, India), 19.4%, 30 out of 155.
  • D12 (region 2, Southern California), 20.5%, 16 out of 78.

The top quarter of districts beat 77% representation, the top half beat 69%, and the top 3/4 beat 56%.

The top regions were:

  • Region 3 (Southwestern US and Mexico), 76.1%
  • Region 8 (Southeastern US and Caribbean), 70.8%.

The vast majority of the votes come from clubs (98.8%, two per club), the rest are “at large” members, which is any current or past International Director (which includes International Presidents and officers), and the current District Directors (they each get one vote, regardless of any clubs they also may represent). At-large votes cannot be assigned to someone else (unlike clubs).

Undistricted clubs are randomly assigned a default district director for their proxy, if they choose to do so (they can assign it to anyone, just like all other clubs). That’s why there’s no “U” line in the spreadsheet (and that’s why a district can have more than 100% of the proxies).

Of those votes from clubs, the large majority are represented by the District Directors. There’s no way of knowing just how many, but based on my informal observations working in credentials, it’s probably 80-90% of the votes (though lower now with remote/online voting).

While there are many more important things for Toastmasters districts to devote scarce resources to (like helping struggling clubs and building new clubs), this shouldn’t be that hard to do. A district proxy chair with a committee to call clubs and round up proxies makes an excellent project!

Full details in the Excel spreadsheet here: Proxies-2022

Here’s my post on the 2019 proxy returns.

Analysis of 2018 Toastmasters tax return 990

The 2018 990 tax return for Toastmasters International has been released. Total revenue was up 10.0%, and expenses were down 4.0%.  Total salaries were down 12.9% (34% of all expenses, down from 37% in 2017), even though the number of employees is up from 181 to 236 (up 30%, partly a recovery from staff loss during the Denver move the previous year).

Expenses and vendors

  • Payroll (including all related expenses, like benefits and pensions) was by far the largest single expense, at $13.4M (but down by 12.9% from 2017).
  • District expenses were $8.7M (down 16%).
  • The magazine cost $2.8M (down 3%).
  • Depreciation added up to $1.4M (61% higher).
  • Insurance was $1.2M (down 14%).
  • Software cost $1.2M (up 49% from $833K; this may or may not include Cornerstone, as they’re a vendor).
  • Transportation (apparently different from “travel”) cost $1.1M (and was not listed in the 2017 return).
  • Travel was $1,017K (up 12% from $908K).
  • Credit card fees were $1,000K (unchanged).

Expenditures on club-building and leadership training by world (not TM) region are interesting, it does cost significantly more to support members outside of North America.

  • North America, $832K (down from $1,061K previous year)
  • East Asia/Pacific, $1,998K (was $1,936K)
  • Europe, $595K (down from $860K)
  • Middle East/North Africa: $461K (down from $742K)
  • Central America/Caribbean: $79K ($66K)
  • Sub-Saharan Africa: $329K ($397K)
  • South America: $6K (was $8K; the decrease is surprising given the focus on growing clubs in Brazil)
  • South Asia: $306K (was $385K)

The five largest vendors for Toastmasters were:

24 more companies were paid at least $100K (each) in 2018.

Employee compensation

Staff paid over $100K/year must be reported (per U.S. non-profit tax law), listed below. This year, some employees (not specifically identified) received relocation benefits (which were grossed up to cover taxes) or retention incentives to stay on until the move (all included in the total compensation reported below).

This year, for the first time, it appears most of the people listed below received a bonus or incentive payment (in 2017, only Dan Rex and Jennifer Quinn received such payments). Interestingly, many of these staffers are showing flat or even a small decrease in base compensation, probably a result of the lower cost of living in Denver, compared to the former WHQ location in Orange County.

  • CEO Dan Rex, $429K base compensation (4.5% decrease) plus a $66K bonus (15% of base), for $574K total compensation (7.9% decrease)
  • Chief financial officer John Bond, $419K total comp (58% increase, mostly in “other compensation”, likely a relocation package; base comp is essentially unchanged)
  • Chief information officer Hamidreza (Sam) Farajian, $409K total comp (21% increase, also mostly in other comp (relocation), base comp is down 12%)
  • Chief operations officer Sally Newell, $358K total comp (down 4%, includes a $125,000 in “other” compensation, and the compensation schedule indicates at least one person received a severance payment, probably her since she left Toastmasters in August 2018)
  • Marketing & communications director William Nissim, $240K (up 30%, but base comp is only up 5%)
  • Chief member engagement officer Darci Maenpa, $220K (down 2%, but base comp is essentially unchanged)
  • IT manager – enterprise architect Sean Mattox, $209K (new to the list)
  • Controller Margaret Yamamoto, $191K (up 22%, but base comp is up only 2%)
  • Application services IT director Nader Hariri, $181K (up 2.3%; base comp is down 3%, but he received an 8% bonus, the highest percentage other than Dan Rex)
  • Business enablement manager Gary Maziarz, $180K (new to the list)
  • Business data analyst Neyra Espinoza, $166K (new to the list)
  • Executive and board relations director Jennifer Barr (was Quinn), $153K (down 33%, but 2017 included $83K for other/relocation; base comp is essentially unchanged; she left Toastmasters in March 2019)
  • Senior product development manager Angela Cunningham, $135K (up 5%)
  • Application services manager Sofia Ageyeva, $139K (new to the list)
  • Communications manager Diana Passow, $138K (new to the list)
  • Publications manager Suzanne Frey, $139K (new to the list)

The CEO’s compensation was established using a compensation board committee, the form 990 tax returns from other organizations, a written employment contract, a compensation study or survey, and approval by the board or compensation committee (per the tax return, Schedule J).  (The tax form includes one other method for determining compensation which is not used by TI, an independent compensation consultant.)

Expenses did include paying for first-class or charter travel, travel for companions, and tax indemnification/gross-up payments (per the tax return), following a written reimbursement policy, and requiring substantiation of expenses.

Revenue and assets

Total program revenue shrank by 4.6%, to a total of $37.8M.  The Toastmasters district conferences globally took in $3.2M in revenue (down 34%, likely due to eliminating the October/November district conferences, an average of about $9 per member).  The annual convention pulled in $1.2M (down 2% from 2017).  For materials sold, the sales revenue only covered half the cost, resulting in a 51% loss on sales. In 2017, the loss was 6.8%, while in 2016, there was an 18.2% profit margin

Total assets grew by 2.1%, to $52.9M, of which $24.9M is cash and investments, equal to 0.63 years of expenses (up from 0.52 years in 2017, 0.56 years in 2016, and 1.2 years in 2015), below the range of the recommendation for non-profits to have 1-2 years of expenses saved up in reserves.  The land and building at WHQ is valued at a net of $25.9M (down 8.5%).  Inventory has decreased by another 13% (after decreasing by 8% in 2016), to $691K.

Net assets grew by almost $4M (10.7%), mostly due to savings and temporary cash investments growing by $3.8M and accounts payable and accrued expenses shrinking by $3.6M (other smaller shifts canceled some of this out).

Donations to Toastmasters International totaled $104K, compared to $76K in 2017 and $40K in 2016 (likely a result of the new marketing of the Smedley Foundation). Donations over $5K must be reported, and two donors met the threshold. F. Dian Prasko of Colony, Kansas, donated $5K (she apparently passed on in November 2018), and the Homer N Allen Charitable Trust of Madison, Florida, donated $25K (details on the trust here).

Related organizations

Two organizations are identified as related, “Toastmasters International Singapore Ltd” and “Toastmasters International (Hong Kong) Ltd”, both companies for “legal and compliance administration” (also controlled by TI).

Click here for the full 2018 tax return.

2017 tax return analysis
2016 tax return analysis
2015 tax return analysis
2014 tax return analysis
2013 tax return analysis
2012 tax return analysis
2011 tax return analysis

After ten years, what Toastmasters clubs have dissolved?

Many questions are asked about how long Toastmasters clubs tend to live, and what kinds of clubs live longer. I’ve compared a 2009 global club roster to a 2019 global club roster to put some numbers on this topic.

32.1% of all clubs in 2009 are gone in 2019, which is about 3% a year (not counting new clubs chartering in that ten years). Company clubs, clubs with specific membership criteria (like being an employee) were far more likely to dissolve. Over half of the clubs 0-3 years old in 2009 had dissolved by 2019. Almost 20% of the 2009 company clubs still around in 2019 had switched to being a community club.

By type of club

Toastmasters classifies all clubs into eight types (open vs. membership criteria is a separate metric). Company clubs are far more likely to have dissolved than community clubs.

  • 61% of all clubs in 2009 were community, and of those, 21.5% were gone after ten years.
  • 28% were company, and of those, 52.6% were gone (2.4 times the rate of community clubs).
  • 4.3% were government, and of those, 35% were gone.
  • Other types are other/specialized, college, correctional institution (prison), church, and military, but in total, they only add up to the remaining 6%.

By open or membership criteria

Toastmasters separately classifies all clubs into either open, or “group specific”, membership criteria (like is commonly found in company-sponsored clubs). It is a separate field though, so you can have a “closed community club” or an “open company club”, even though those don’t seem to make much sense to me.

  • 70% of all clubs in 2009 were open, and of those, 24% were gone after ten years.
  • 30% were group specific, and of those, 51% were gone.

By club officer terms

Clubs are also grouped into either annual or semiannual terms for the officers. Only weekly clubs can (optionally) have semiannual terms; all other clubs must have annual terms. This was not a factor in predicting whether a club was likely to close, with nearly identical data for both types.

  • 83% of all clubs in 2009 have annual officer terms, and of those, 32% were gone after ten years.
  • 17% have semiannual terms, and of those, 32% were gone.

By age

Based on their ages in 2009, the clubs most likely to close were the youngest. Clubs that were less than three years old as of 2009 were 53% likely to have dissolved by 2019. Only 17% of clubs at least 20 years old in 2009 had dissolved by 2019. Clubs under five years old in 2009 accounted for 52% of all the clubs gone by 2019.

Sadly, this ten-year period saw six clubs of over 70-82 years age (as of 2009) dissolve, including club #3-Los Angeles Toastmasters, founded in June 1927.

  • 0-1 year old in 2009: 55% dissolved by 2019.
  • 1-3 years old: 52%
  • 3-5 years old: 44%
  • 5-10 years old: 33%
  • 10-20 years old: 23%
  • 20-30 years old: 20%
  • 20-50 years old: 13%
  • 70+ years old: 11%

Other interesting data

The average club age today is 15.7 years old. The median club age (half older, half younger) is 9.4 years old. Of the clubs that dissolved from 2009 over the next ten years, they were on average 9.3 years old in 2009, and the median was 4.5 years in 2009 (they were generally quite young).

Changing club types

Clubs show an interesting history of changing types, e.g., from company clubs to community (or vice versa).

  • For clubs identified as a company club in 2009 (and still around in 2019), 19.9% of them switched to community clubs by 2019 (326 out of 1,636). Another 2.6% had switched to some other type; 1.2% (19) of them had switched to government agency.
  • For clubs identified as community clubs in 2009, just 1.7% (101) of them had switched to another type, 0.8% to company, 0.4% to other/specialized.
  • For clubs identified as aligned with a government agency in 2009 (345 in total), 15.7% (54) had switched to community by 2019.
  • For clubs identified as “other/specialized” in 2009 (206 in total), 37.4% had switched to community by 2019.

Trends by district and country

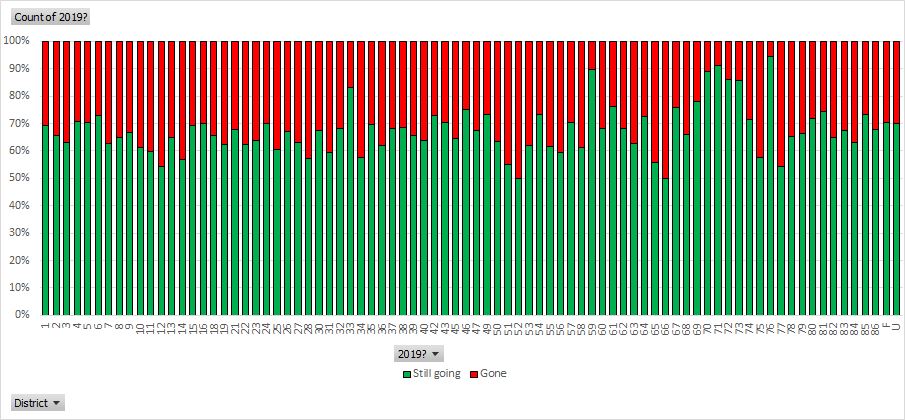
Some districts and some countries do far better at retaining clubs (like D76-Japan), while others do much worse (perhaps due to short-term conditions, like natural catastrophes).

Club loss 2009-2019 by district
Club loss 2009-2019 by country (countries with less than 10 clubs in 2009 omitted, listed in order from the most clubs on the left to just 10 on the right)